v2 board ・ Arduino Nano ESP32

ACCEL KITCHEN — COSMIC RAY DETECTOR v2

Counting particles
from space, one by one.

A SiPM picks up the scintillator's light and a peak-hold circuit captures the pulse height. An Arduino Nano ESP32 logs pulse height, time, temperature, humidity and pressure as one line per event, and outputs it to USB, Bluetooth and microSD at once. Connect up to three external detectors and measure in coincidence.

Preparing the 3D model
SCROLL

01 — INSIDE

Every part
has a job.

From receiving the light to recording it. The camera moves to each part in turn.

01 / 10

Receive the light Scintillator × SiPM

When a muon passes through the scintillator, part of the energy it deposits becomes light. A 6 mm-square SiPM (onsemi MICROFC-60035) turns that light into an electrical pulse. The SiPM sits on a 40 mm-square daughter board, and the whole daughter board can be swapped for another type.

  • Microcells 35 µm × 18,980
  • Vbr 24.2–24.7 V
  • J1 / J2: HV, GND, signal ×2
02 / 10

Make the bias HV 29.0 V

An LT3461 on the back steps the USB 5 V up to 29.0 V, which is 4.3–4.8 V above the breakdown voltage. The value is fixed by a resistor divider. The daughter board's 49.9 Ω and 10 µF filter out noise before the voltage reaches the SiPM.

  • HV = 1.255 × (1 + 221k / 10k)
  • L1 47 µH
03 / 10

Amplify LT1807 (U2A)

The SiPM current becomes a voltage across R12 (49.9 Ω) on the daughter board and is amplified by the non-inverting amplifier U2A. The gain is ×5.0–×45, set by trimmer R10 on the back. The input is protected by 1 kΩ and a BAT54S. The amplifier output can be measured at TP2.

  • G = 1 + (R5 + R10) / R3
  • R3 249 Ω・R5 1 kΩ
  • DC coupled
04 / 10

Catch the peak Peak hold and threshold

The peak hold around U2B doubles the peak of a pulse a few hundred ns long and stores it on capacitor C6. The stored voltage appears at A0. Once the microcontroller has read it, D8 sends a 20 µs pulse that discharges C6 through Q1, ready for the next pulse.

  • Hold ×2
  • Output to A0
  • D8 → Q1 discharge
05 / 10

Read Arduino Nano ESP32

It keeps reading A0 (the peak-hold output) and treats anything above the threshold as an event. After waiting for the external detectors' coincidence flags, it reads A0 with the 12 bit ADC, and that value is the pulse height. At every start-up it watches A0 for one second and sets the threshold to the noise maximum + 50.

  • ESP32-S3 · BLE
  • A0 compared in software
  • Read about 60 µs after the trigger
06 / 10

Record microSD

Logs are written to a FAT32 card starting from /LOG0001.TXT. Each line is committed as it is written, so even if you pull the USB cable you lose at most the last line. The lines are exactly the ones sent over USB and Bluetooth.

  • Hirose DM3AT
  • SPI 4 MHz
  • Insert from the side
07 / 10

Measure the environment BME280

Temperature, humidity and pressure are read every 2 seconds and written into every event line. You can study the “barometric effect”, where the count rate drops as pressure rises. The SiPM breakdown voltage shifts by about 21.5 mV per °C, so temperature is also what you use to re-examine pulse heights later.

  • I²C
  • Temperature, humidity, pressure
08 / 10

Notify OLED, LED, buzzer

A 0.96-inch OLED standing at the edge of the board shows the count, rate, threshold and environment values every 2 seconds. An LED flashes on every event and the buzzer beeps at a pitch that follows the pulse height (500–4000 Hz, logarithmic). Add a vibration motor on A7 and bigger pulses shake for longer.

  • SSD1306 128 × 64
  • 25 ms beep
  • Vibration 20–120 ms
09 / 10

Connect 3.5 mm jacks × 4

One OUT and three INs. When it triggers, it outputs COIN_OUT (3.3 V, 100 µs), waits 50 µs and reads the others' COIN_OUT. If a partner reacted at almost the same moment, that jack's column becomes 1. The analog pulse height can be read too.

  • TRRS cable
  • Up to 4 units
  • Coincidence window about ±50 µs
10 / 10

Enclose 3D-printed case

A two-piece design: the board drops into a box with a floor, and a lid is fixed with four M2 screws. The front has a window for the OLED and holes for RESET and the LED; the side has USB and a square opening holding the four jacks and the microSD slot. A clear light pipe carries the LED's light to the hole on the front. The STL files are in cad/.

  • FDM printed
  • 86 × 75 × 61.4 mm
  • Lid: 4 screws

02 — EXPLORE

Spin it freely, click a part.

Drag to rotate, right-drag to pan. Click a part to see its description.

Tap “Interact” to rotate it with your finger.

PART

Click a part

More than 80 parts, from boards and case to screws, come with descriptions.

SCINTILLATOR

Choose from
two scintillators.

The board and case are the same; only the part that emits light differs. Choose by whether you want to collect widely or carry it small.

  • Plastic scintillator version 5 cm × 5 cm × 1 cm

    A wide, plate-like shape. Its 25 cm² of area catches plenty of cosmic rays, so counts add up even in a short time. It suits following changes in the count rate and coincidence with two units stacked.

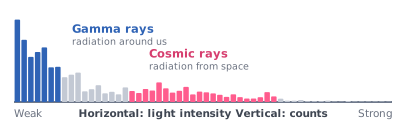
    A spectrum taken with the plastic scintillator. Gamma rays form a peak on the weak-light side and cosmic rays on the strong-light side, clearly separated
    The spectrum you getGamma rays (radiation around us) on the weak-light side, cosmic rays (radiation from space) on the strong-light side. You can select and count only the cosmic rays.
  • CsI scintillator version 1 cm cube

    A small, die-like shape. It is compact, suited to carrying around and to installing in tight spots. With less area it counts fewer cosmic rays.

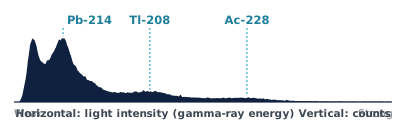
    A gamma-ray spectrum of granite measured with the CsI detector. Several peaks appear, and their positions show gamma rays from Pb-214, Tl-208 and Ac-228
    The spectrum you get (measuring granite)Peaks stand at each gamma-ray energy. From their positions you can read the gamma rays emitted by Pb-214, Tl-208 and Ac-228, formed along the decay chains of the uranium and thorium in granite.

Both work the same way: a passing cosmic ray makes light, and the SiPM turns that light into an electrical pulse. The horizontal axis is light intensity (= deposited energy) and the vertical axis is the number of counts. The count rate is roughly proportional to the scintillator's area (as a guide, about 1 per cm² per minute at sea level).

ACTUAL UNIT

This is what the real one looks like.

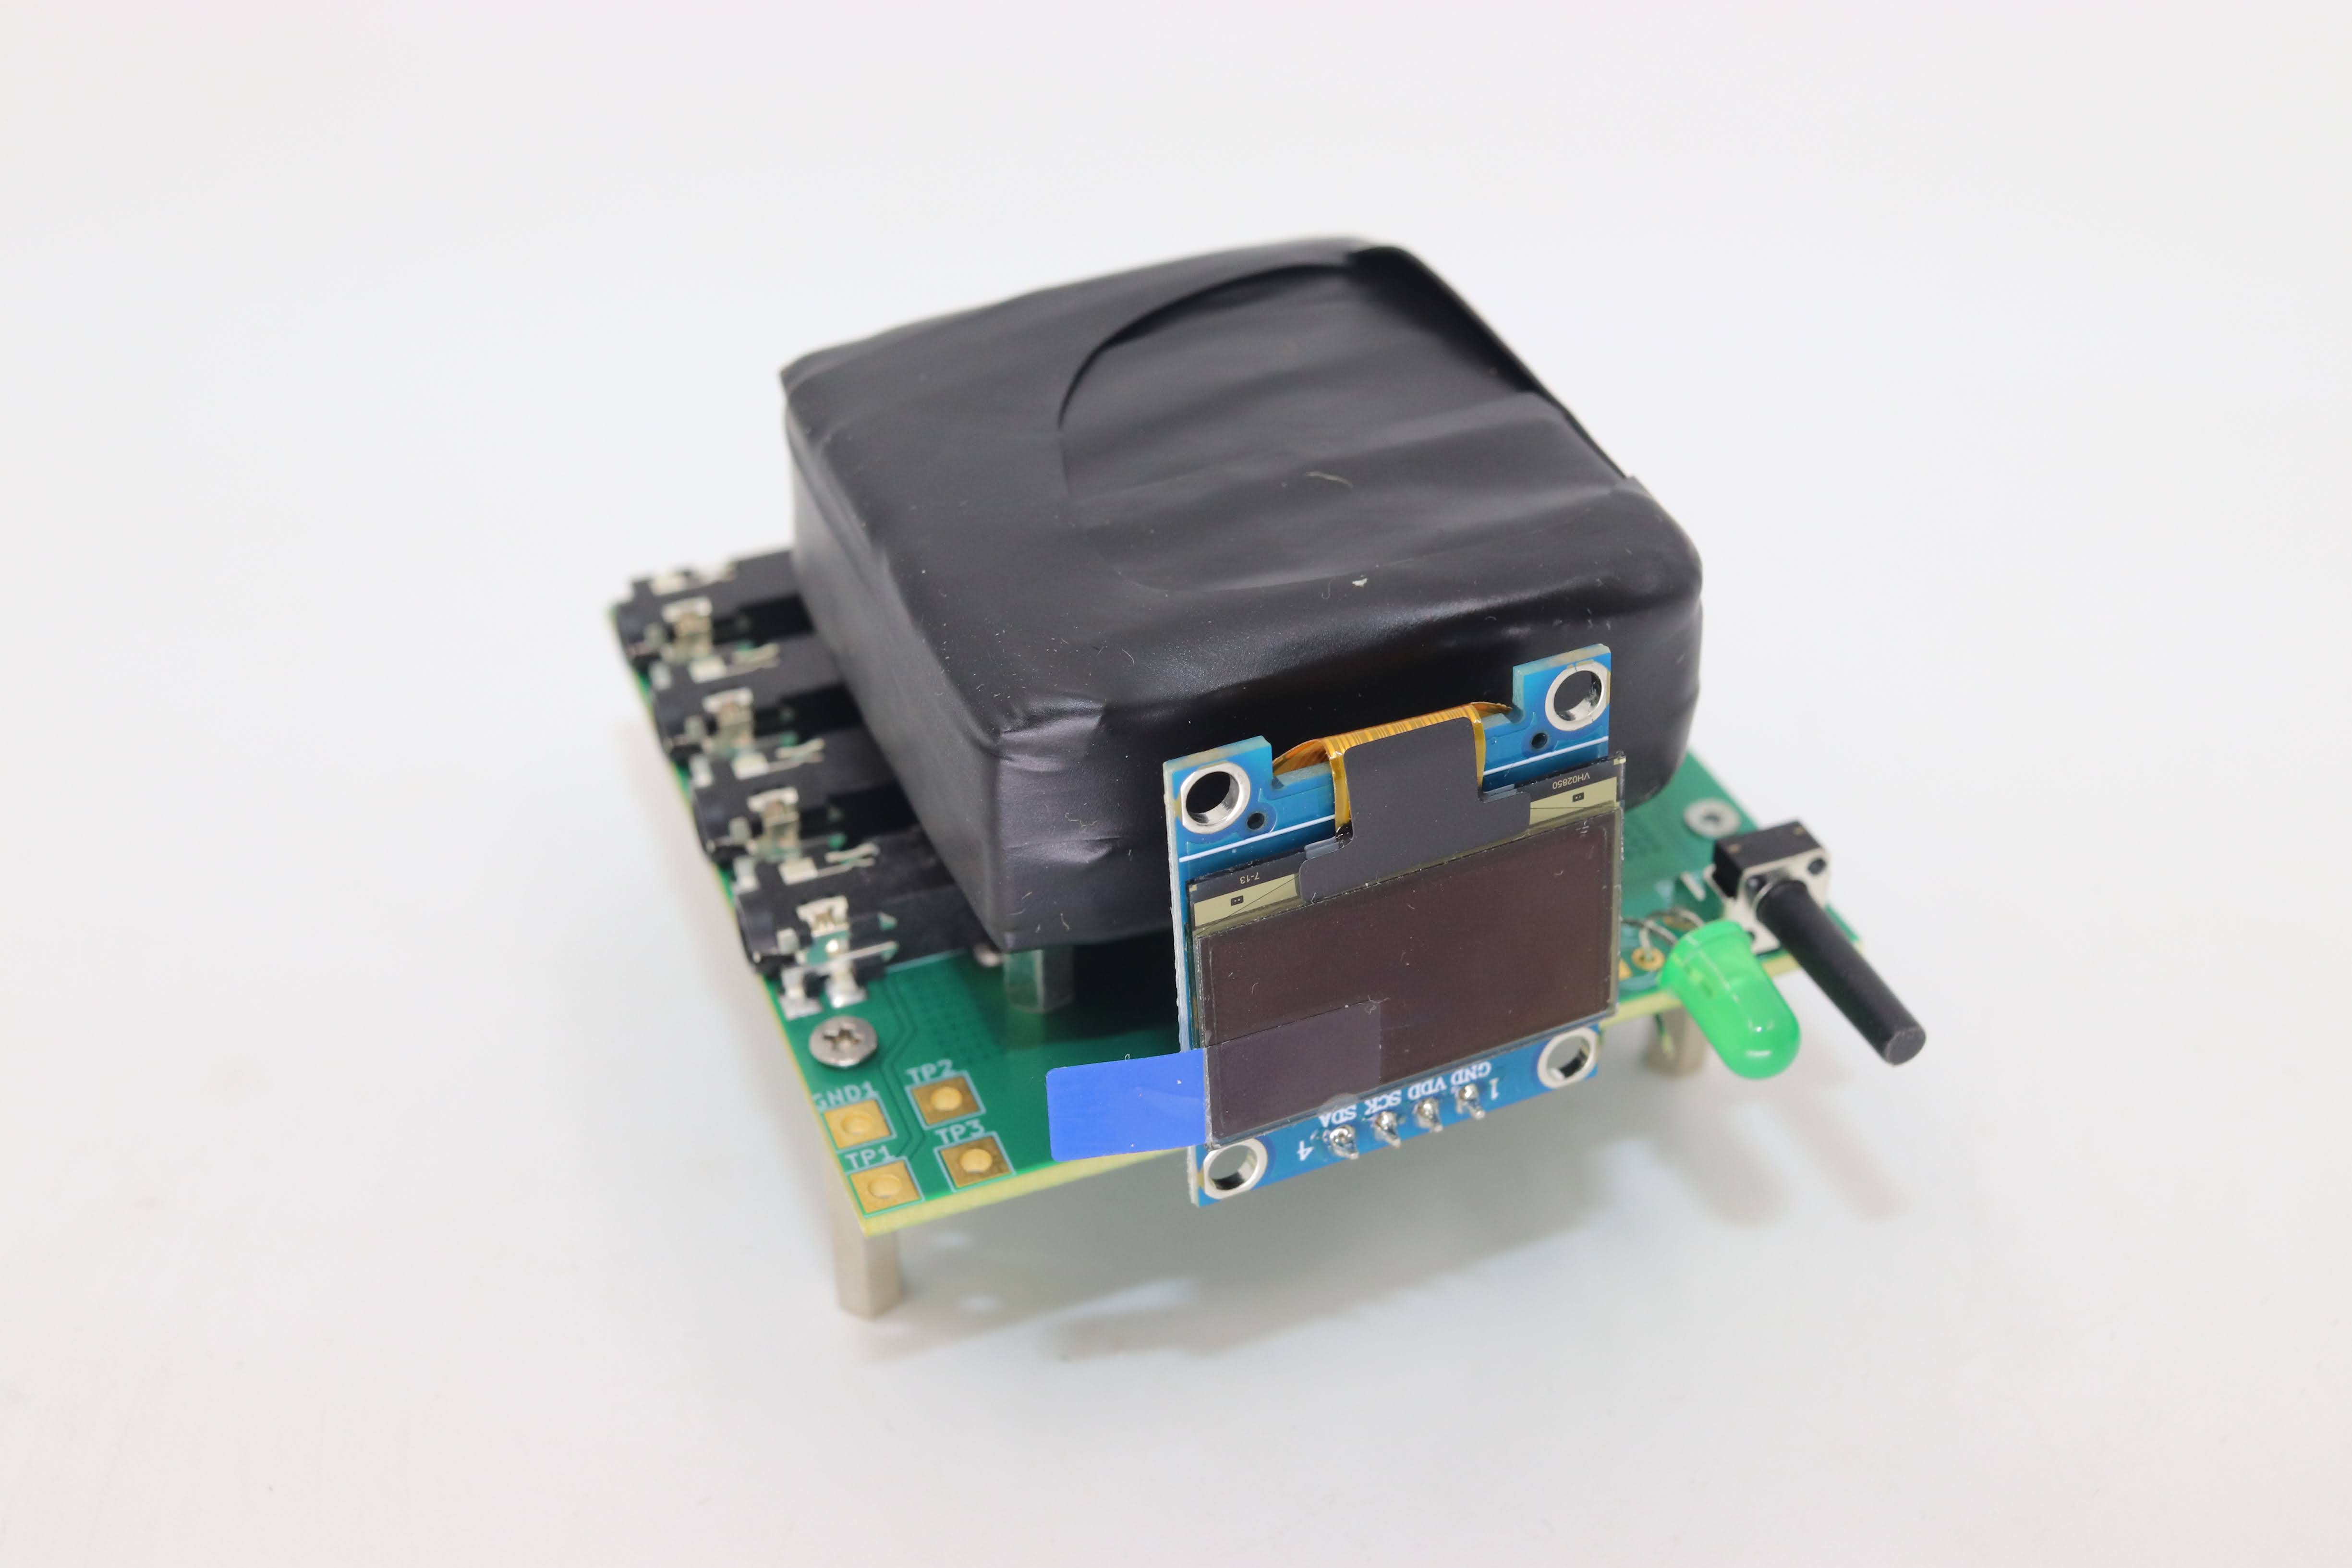
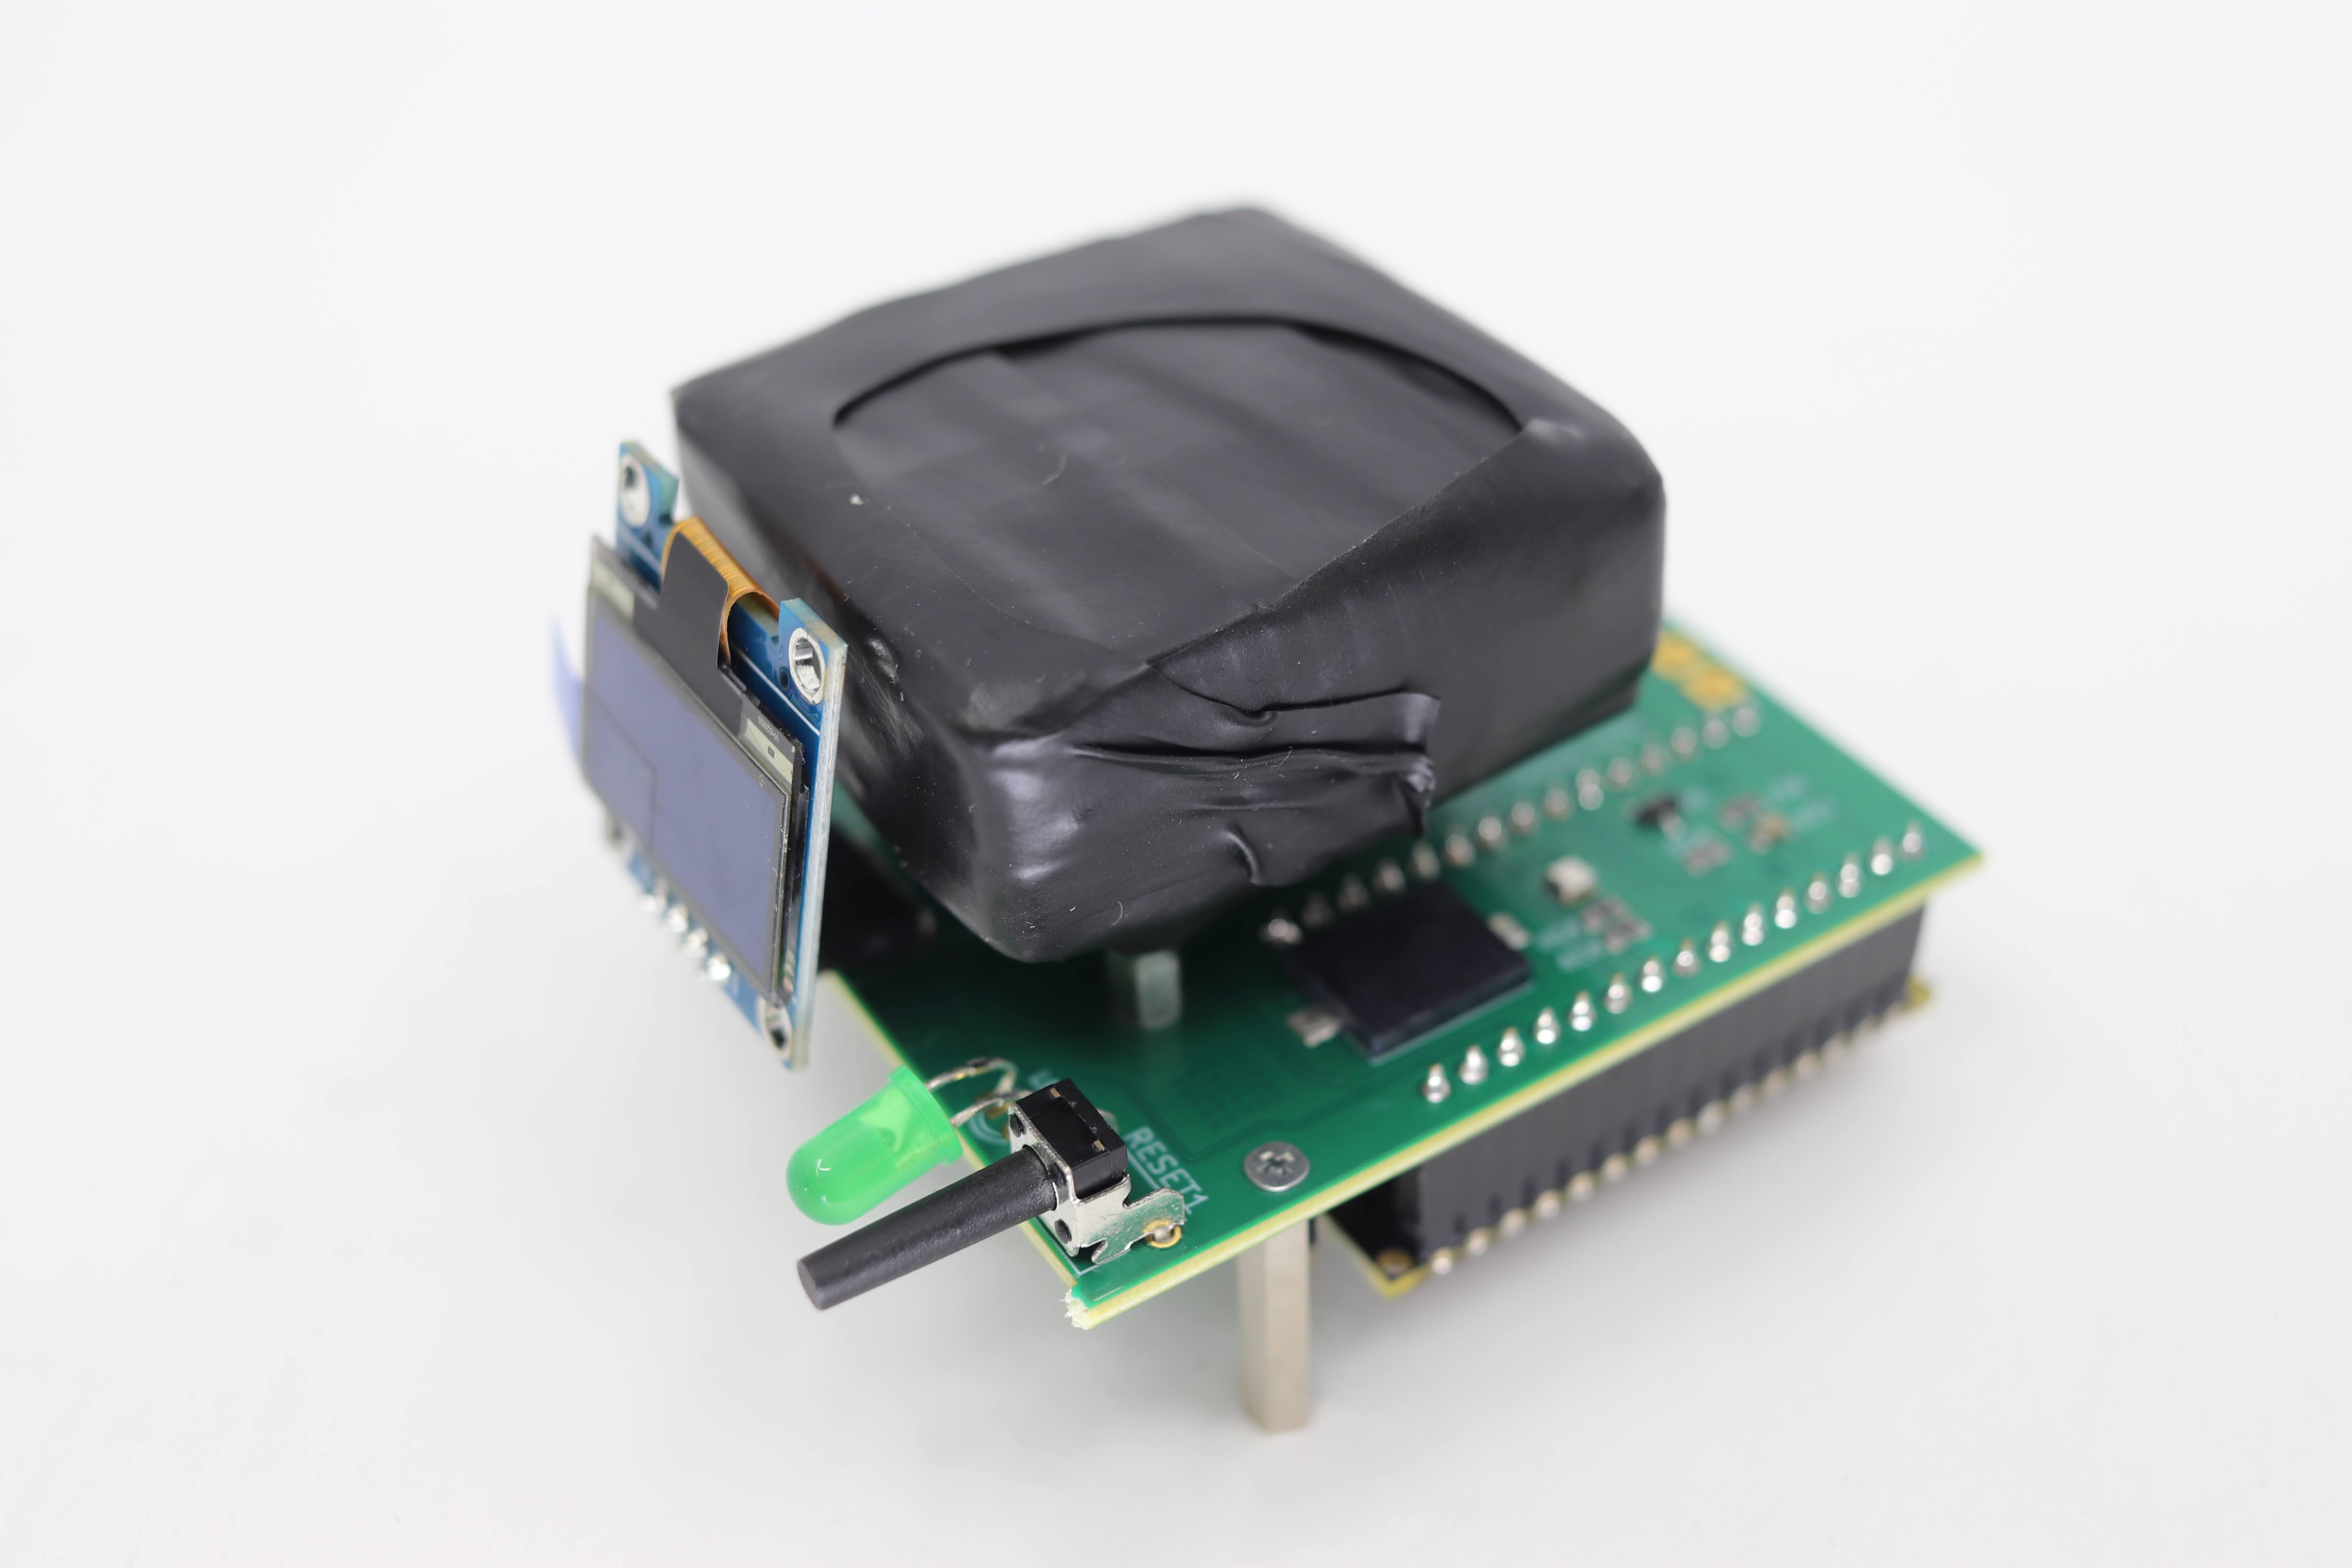
Photos of the prototype. The square block wrapped in black tape is the scintillator and SiPM. The count appears on the blue OLED in front, and a green LED lights at the board's edge.

The detector seen from diagonally in front: a scintillator wrapped in black tape sits on the board, with the OLED standing in front
From the frontThe four jacks on the left, the button and LED at the right end.
The detector seen from the side. Spacer posts and the Nano socket are visible under the board
From the sidePosts lift the board, and the Nano plugs in underneath.
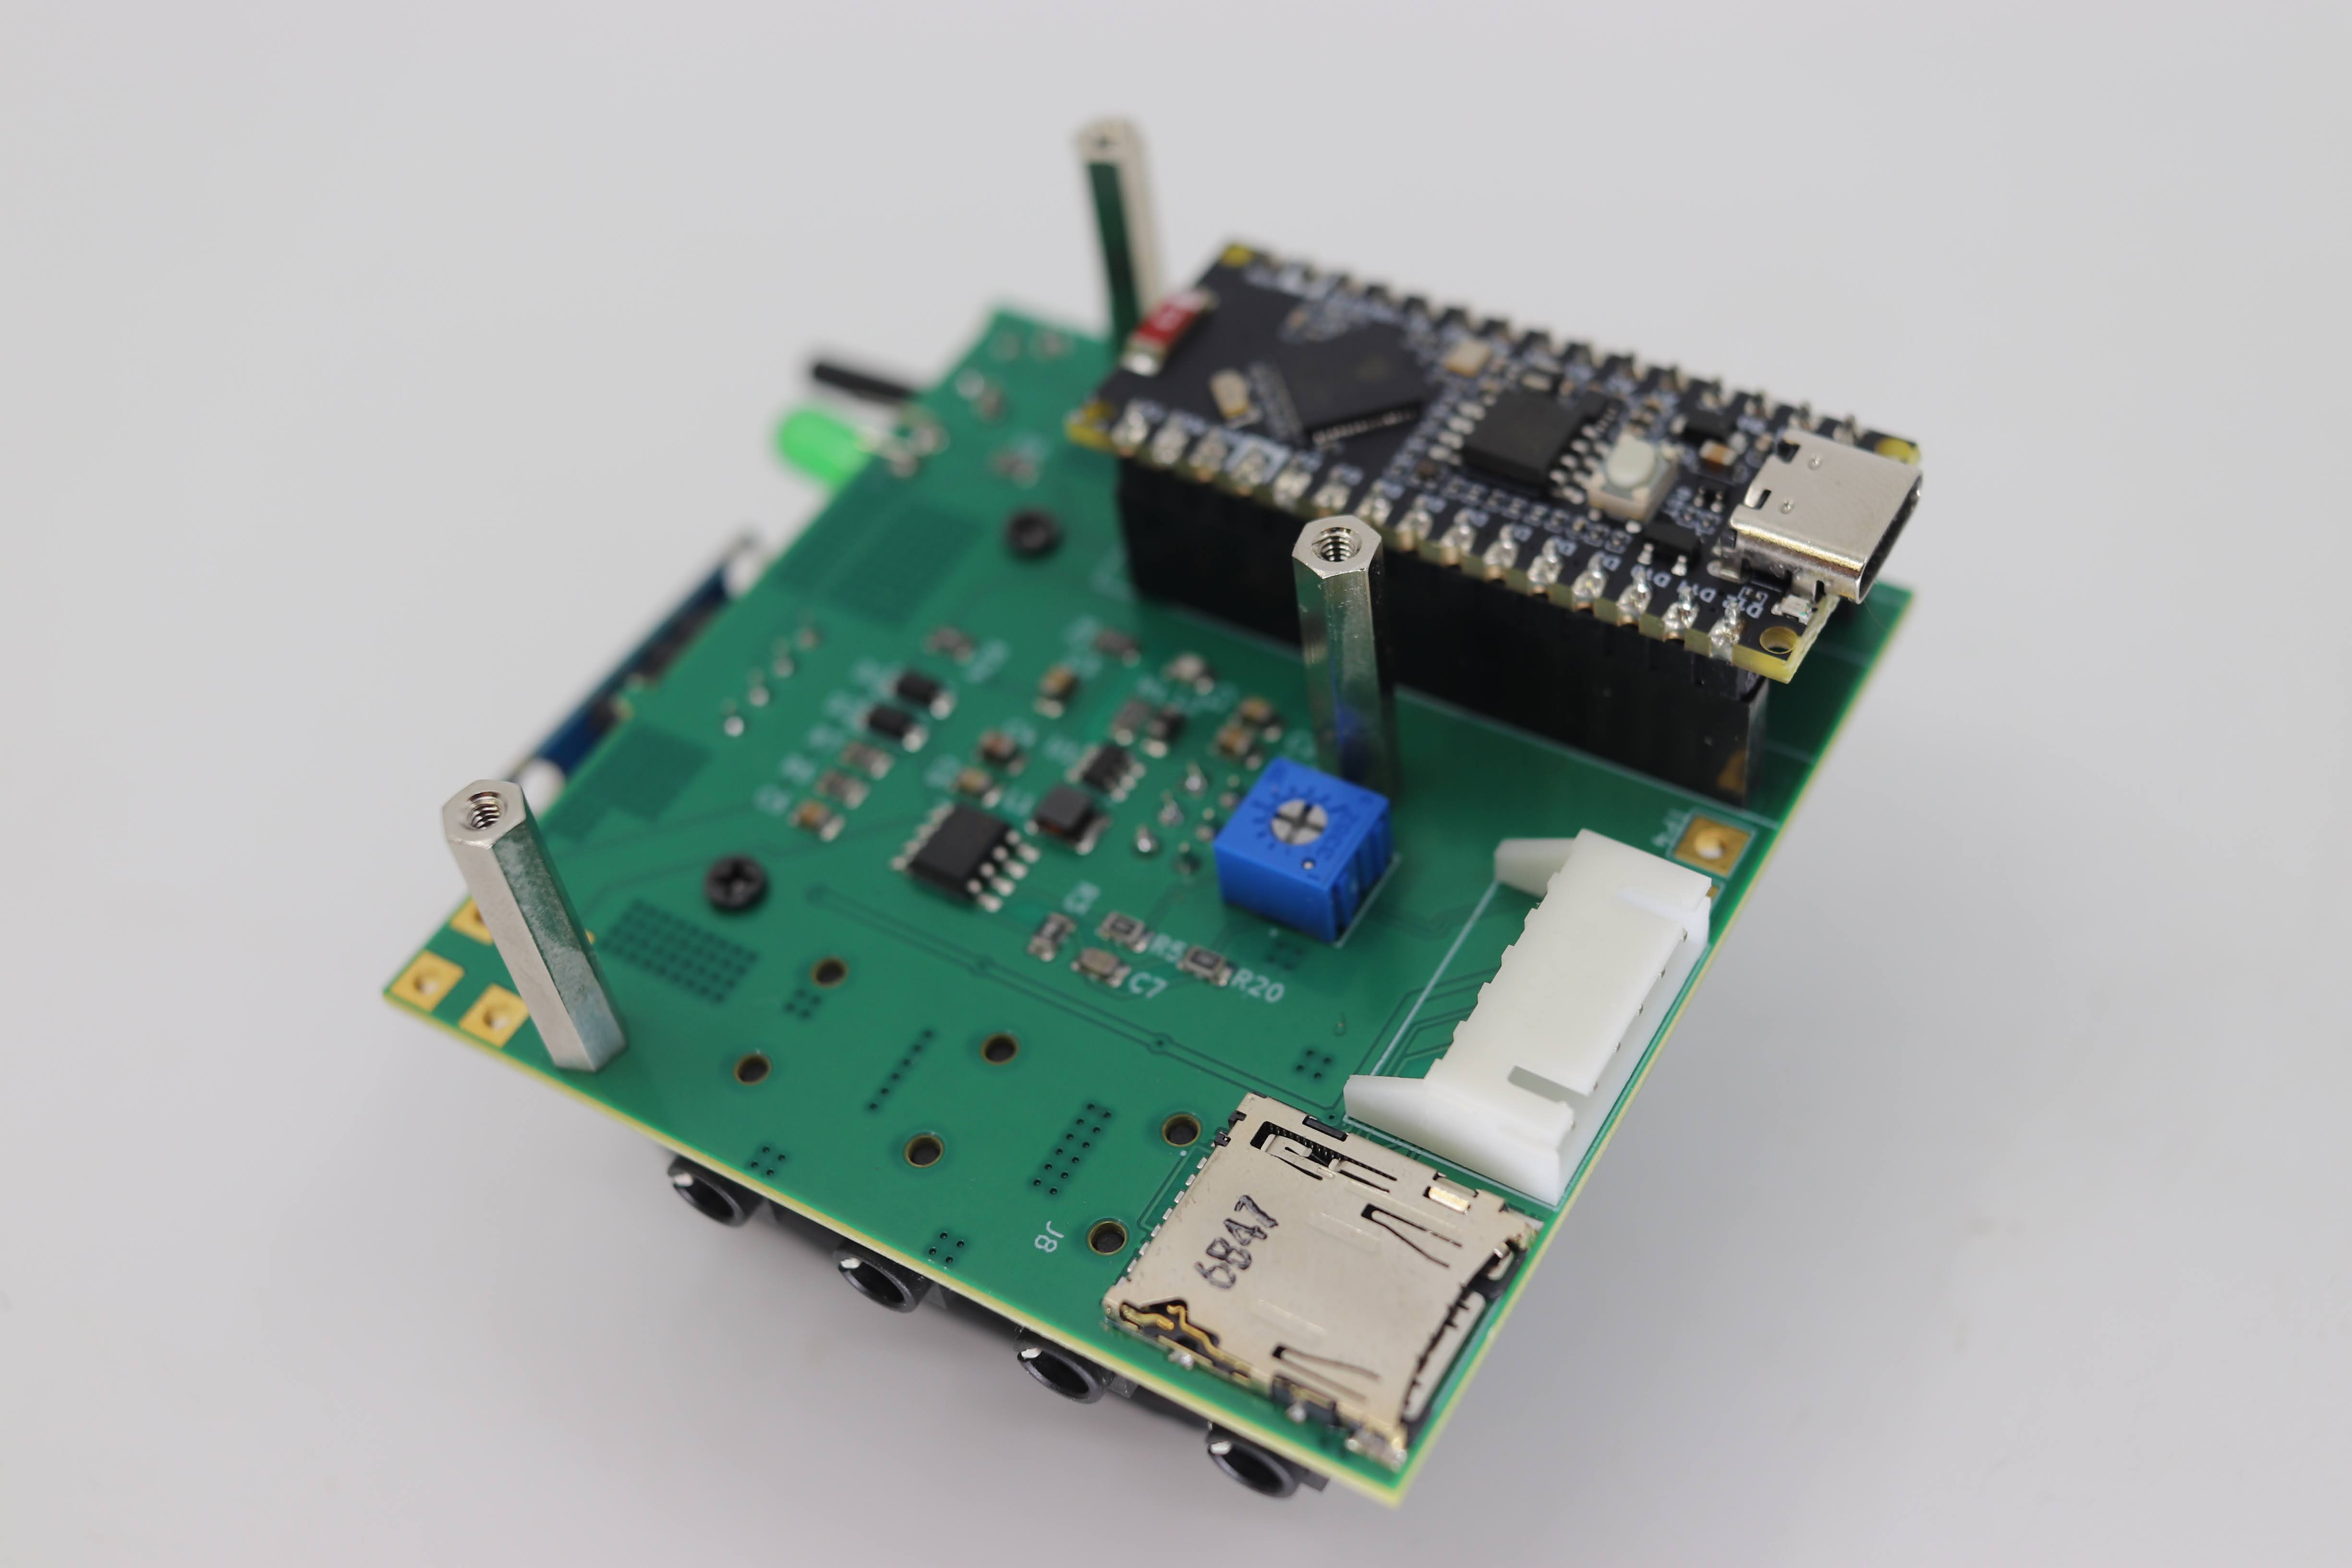
The readout board with the scintillator removed. The Arduino Nano ESP32, microSD slot and gain trimmer are visible
On the boardNano ESP32, microSD, and the blue gain trimmer.
RunningCnt and Rate appear on the OLED.

03 — PHYSICS

How cosmic rays get counted

  1. ①
    Passing through

    A primary cosmic ray (mostly a proton) collides with an atomic nucleus high in the atmosphere and makes a shower of particles. Almost everything that reaches the ground is a muon: about 1 per cm² per minute at sea level.

  2. ②
    Light

    As a muon crosses the scintillator it loses energy, and part of that becomes light. About 2 MeV per cm in plastic (blue light), and about 5–6 MeV per cm in CsI.

  3. ③
    SiPM

    A SiPM with 18,980 microcells of 35 µm. A cell hit by a photon undergoes avalanche multiplication.

  4. ④
    Pulse

    R12 (49.9 Ω) on the daughter board turns it into a voltage: a fast pulse of a few hundred ns.

  5. ⑤
    Amplify and hold

    It is amplified ×5–×45, and the peak hold stores double the peak height. When the voltage at A0 exceeds the threshold, it is read as an event.

  6. ⑥
    Record

    About 60 µs after the trigger, A0 is read with the 12 bit ADC and output as one line together with the time and environment values. Once read, D8 empties the hold.

04 — SIGNAL

Play with the signal of one event.

Change the pulse size, the amplifier gain and the threshold, and the amplifier output, the peak hold and the recorded pulse height (the ADC column of the log) change. The hold capacitor can only charge at 1.36 V per µs, so faster pulses lose more of their peak.

TP2 peak
—
Hold (C6)
—
Trigger
—
A0 at read time
—
ADC column in the log
—

A rough guide using the same first-order model as arduino/shaping.html (SiPM 60035 + GAGG:Ce, R12 = 49.9 Ω, TP2 half-width 432 ns), plus a peak hold limited by charge (U2B output current 30 mA ÷ C6 22 nF). “Muon” is a size that would give 7.9 V at TP2 if the amplifier had no rails; in practice it saturates at 4.9 V. The hold discharge has a 300 µs time constant, and the ADC is approximated with about 3.1 V as full scale.

05 — COINCIDENCE

Stack them, and they become a telescope.

Muons travel near the speed of light, so they pass two stacked units almost simultaneously. SiPM noise and environmental radiation mostly hit just one. Keep only events where “both reacted at almost the same time” and you pick out muons more reliably. The wider you space them, the more only near-vertical rays remain.

Top (A)0
Bottom (B)0
Coincidence (A∧B)0
Share of A that also went through B—Expected —

Accidental coincidences (background)

Two unrelated events happen to fall inside the window (±W) at a rate of 2 × W × R1 × R2. The v2 window is about ±50 µs.

About 0.36 per hour

OUTJ3

COIN_OUT (D7, 3.3 V, 100 µs) and its own peak-hold output ANA_OUT

IN 1J5

Reads the partner's COIN_OUT on D6 and the analog on A1

IN 2J6

Likewise D5 / A2

IN 3J7

Likewise D4 / A6

06 — USE CASES

Take it out, and you see
all kinds of cosmic rays.

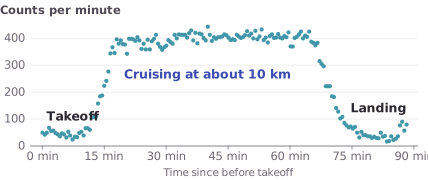
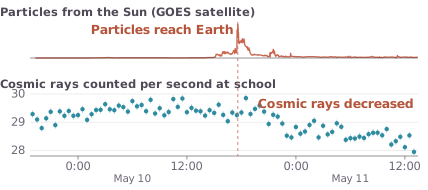
The number of cosmic rays changes with place, height and solar activity. Here are examples of real measurements.

On Mt. Fuji

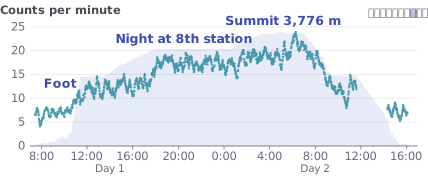
Counts were recorded every minute while climbing. The higher you go, the thinner the air and the more cosmic rays arrive. From about 7 per minute at the foot, it rose to about 20 near the summit.

Cosmic-ray counts and altitude while climbing Mt. Fuji. As altitude rises, counts increase from about 7 per minute to about 20

Dots are the cosmic-ray counts; light blue is the height climbed. Measured on a two-day climb with one night on the mountain.

The graphs are real measurement examples. The numbers you count depend on the type and size of the detector. The moving pictures are illustrations based on measurement trends (the Forbush decrease is exaggerated to be easier to see).

07 — WEB APPS

From measuring to analysis,
in the browser alone.

Nothing to install. Open the console in Chrome or Edge and connect over USB (Web Serial) or Bluetooth (Web Bluetooth). Below is a demo of that screen; press the buttons to try it.

arduino/v2/console/index.html DEMO · time ×10
CosmicRay Recorderv2 Not connected

Data recording app for Cosmic Ray Detector v2

Let's count cosmic rays

Connect the detector to your computer and the cosmic rays that arrive turn into graphs on the spot.

  1. 1 ConnectBy USB or Bluetooth
  2. 2 MeasureThe graphs grow with each arrival
  3. 3 SavePick a folder to record automatically
Total events0
Average count rate0.000/s ± —
Elapsed time00:00:00

Energy distributionADC histogram, bin width 64

Count rate over timeEvery 20 seconds

Temperature
-- °C
Humidity
-- %
Pressure
-- hPa
External detectors
--
Mean ADC
--
Dead time
-- s
Trigger
Analog

A0 waveform read every 12 µs (32 points before the trigger, 128 after). Counting stops while it is shown.

Peak ADC
--
Waveforms
0
Rate limit
3 /s
Persistence
20
Waiting for data…
  • USB and Bluetooth

    Web Serial and Web Bluetooth (Nordic UART). They work with the same commands and responses, and Bluetooth reconnects automatically if it drops.

  • Auto-save

    Pick a folder and incoming data is written continuously as .dat and .csv. The file splits when the date changes.

  • Histogram and count rate

    Pulse-height distribution, count-rate history, and statistics for temperature, humidity and pressure. The count rate is computed with dead time subtracted.

  • Oscilloscope

    Reads A0 by DMA at 83.3 kHz (every 12 µs) and shows each event's waveform in 161 points. Counting stops while it is open.

  • Threshold and functions

    Signal threshold (with auto-adjust at start-up), and switches for microSD, external detectors, OLED, buzzer and vibration, all by button.

  • Send to a server

    Upload to the measurement server in real time, for comparing multiple sites. The display can switch between Japanese and English.

Other tools

08 — DATA

Every time a cosmic ray arrives,
its surroundings are saved too.

Each detection makes one line of record. It is plain text separated by spaces, so spreadsheets and Python can open it as is.

  • Particle size

    How much energy the passing particle deposited. As a histogram, you see the peaks for cosmic rays.

  • When it came

    Time since start-up, in microseconds. You can follow changes in the count rate and the gap between individual events.

  • Temperature, humidity, pressure

    The local environment is recorded with every event. You can check the “barometric effect”, where the count rate falls as pressure rises, with your own data.

  • Whether other detectors reacted

    For each event, it keeps whether the connected detectors (up to 3) reacted at the same time. Stack them and you can select only cosmic rays coming from straight above.

  • Other detectors' pulse heights

    Also the size of the particle seen by the partner that reacted together, useful for comparing the same particle measured by two units.

  • Time not measured

    Time when it could not count, such as while writing data, is recorded too, so you can compute the correct count rate.

0units

measuring at once, at most

0

places to record (USB, Bluetooth, microSD)

0kinds

of environment values (temperature, humidity, pressure)

0by one

cosmic rays counted and recorded

09 — START

Your first measurement

With the firmware written, it starts measuring as soon as you connect USB-C.

  1. 1
    Attach the sensor daughter board

    With USB unplugged, plug the daughter board's J1 into the readout board's J2 and fix it with M2 spacers and screws.

  2. 2
    Press the scintillator on and block the light

    Wrap it in reflector, seal out the light with black tape and set it on the SiPM. Any gap lets fluorescent light spike the count.

  3. 3
    Insert a microSD (optional)

    Put a FAT32 card into J8 through the opening on the side. Without it, output still goes to USB and Bluetooth.

  4. 4
    Connect USB-C

    To a PC or a mobile battery. At each start-up it watches A0 for one second to decide the threshold, so leave it still while it does.

  5. 5
    Watch the OLED and LED

    If Cnt rises, the LED flashes and the buzzer beeps, it is working. Thr: is the threshold.

  6. 6
    See it in the console

    Open arduino/v2/console/index.html in Chrome / Edge and press “Connect by USB”. Over time the histogram grows and the count-rate error shrinks.

10 — SPEC

Specifications

Detection
Scintillator + SiPM (onsemi MICROFC-60035-SMT: 6 × 6 mm active area, 35 µm microcells). The SiPM sits on a 40 × 40 mm daughter board, connected by a 2×3 pin header
SiPM bias
LT3461 boost, fixed at 29.0 V (from USB 5 V). RC filter on the daughter board
Amplifier
LT1807 (U2A) non-inverting, ×5.0–×45 (set by R10). Input protection 1 kΩ + BAT54S
Peak hold
LT1807 (U2B) + diode + C6, holding ×2 of the amplifier output. Discharge time constant is a few hundred µs (487 µs calculated). D8 → Q1 discharges for 20 µs
Microcontroller
Arduino Nano ESP32 (ESP32-S3, BLE). Plugs into the socket on the back
Trigger
Analog. A0 (the peak-hold output) is compared with the threshold in software, and anything above it is recorded as an event. The threshold is set automatically at start-up and can be changed afterwards
Pulse height
12 bit (0–4095). A0 is read once, about 60 µs after the trigger
Dead time
Event handling (about 0.1 ms), the OLED refresh every 2 seconds, while the oscilloscope is shown, and while commands run. The cumulative value is output in the log
Environment sensor
BME280 (temperature, humidity, pressure), updated every 2 seconds
Display and alerts
OLED SSD1306 128 × 64, LED, piezo buzzer (500–4000 Hz), vibration motor (added on A7, needs a driver)
Recording and communication
USB serial (9600 bps), Bluetooth LE (Nordic UART, name CosmicRay), microSD (FAT32, committed line by line)
External I/O
OUT × 1, IN × 3 (3.5 mm 4-pole). Digital coincidence and analog pulse height
Oscilloscope
A0 by DMA at 83.3 kHz, 161 points per event. 1–20 waveforms per second
Power
USB-C 5 V
Size
Readout board 63 × 63 mm, sensor daughter board 40 × 40 mm, case 86 × 75 × 61.4 mm

Values come from the schematic (KiCad 9), the firmware (COSMICRAY_DETECTOR_ESP32-S3-Nano-v2), arduino/description.md and shaping.html. The successor v2.1, which reflects a circuit review, replaces the shaping stage and uses a DAC-set threshold. This device is for counting natural cosmic rays and is not calibrated as a dosimeter.